TikTok Analytics: how to analyze your performance
Mastering TikTok Analytics means understanding why some videos take off while others do not. This guide explains every key metric—retention, traffic sources, demographics—to turn your data into concrete decisions and refine your content strategy.


Contents 9 sections
- 1 Enabling TikTok Analytics: switching to a Business or Creator account
- 2 Overview: the KPIs to monitor every week
- 3 The Content tab: identifying your best-performing videos
- 4 Traffic sources: understanding where your views come from
- 5 Followers tab: analyzing your audience demographics
- 6 Third-party analytics tools: going beyond the native interface
- 7 Turning your data into a concrete action plan
- 8 Frequently asked questions
- 9 Summary and next steps
TikTok Analytics is the platform's most underused tool. Thousands of creators post regularly without ever opening the analytics tab - and then wonder why their growth has stalled. Yet every video generates a wealth of actionable data: where views come from, how many seconds viewers stay, and what percentage of the audience returns to your profile.
The issue is simple: without carefully reading these metrics, you are flying blind. You may be repeating your least effective formats while thinking you are doing the right thing, overlooking posts that nearly took off, or publishing at the wrong time for your actual audience. Data corrects all of this - provided you know how to interpret it.
This guide reviews every section of TikTok Analytics, explains what each figure means in practical terms, and shows you what corrective actions to take. From second-by-second retention curves to traffic sources, engagement KPIs, and third-party tools, you will come away with a practical analysis method.
Enabling TikTok Analytics: switching to a Business or Creator account
Access to complete analytics requires a Creator or Business account on TikTok. Switching is free. In the app, go to your profile, open the menu (the three lines at the top right), then select “Settings and privacy” > “Manage account” > “Switch to Business Account.” You can then choose a Creator or Business account depending on your activity.
Once enabled, TikTok Analytics is available through TikTok Studio: in the app, go to your profile > menu > “TikTok Studio” > “Analytics” > “View all.” In a browser, go directly to studio.tiktok.com, then click the “Analytics” tab in the left-hand menu.
According to the official TikTok Creator Academy documentation, the Analytics interface is divided into several tabs: Overview, Content, Followers, and a LIVE tab if you livestream. You can select an analysis window covering the last 7, 28, 60, or 365 days, or create a custom report. Data can be exported for up to 365 days at once from the desktop version - allowing you to build a solid historical database and identify trends across long cycles that the native interface alone does not reveal.
Overview: the KPIs to monitor every week
The Overview tab aggregates your overall performance for the selected period. It displays post views, profile views, likes, comments, shares, as well as traffic source data and the search queries that led users to your content. Here are the indicators to prioritize.
Views, reach, and impressions
Video views count every play, including repeat plays by the same user. Reach (or “accounts reached”) is the number of unique profiles exposed to your content. The difference between these two figures indicates your repeat-view rate - a large gap means that people are watching more than once, which can signal a strong hook or memorable value.
Impressions include every appearance of your content in a feed, even when it is not played. The views-to-impressions ratio is your implicit click-through rate - if many people see your thumbnail without starting the video, revisit your first second and hook visual.
Followers gained and profile visits
The number of followers gained during the period and your profile visits reveal your ability to convert a casual viewer into a follower. If your views are rising while this metric remains flat, it may indicate an editorial consistency problem: viewers enjoy the video but do not yet see the value of following your account. To understand the levers that turn views into loyal followers, a combined analysis of views and profile visits is essential.
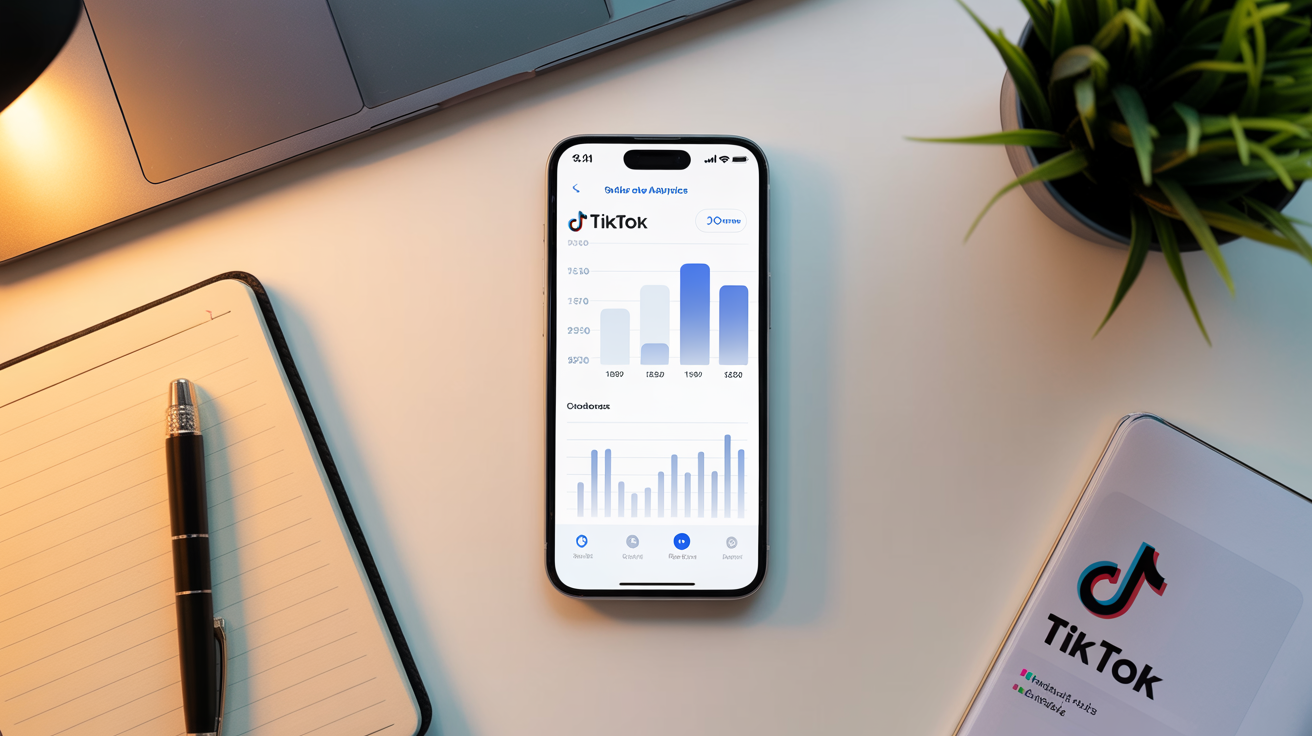
The Content tab: identifying your best-performing videos
This is the most practical section of TikTok Analytics. The Content tab helps you identify your best videos through the “Top posts” section, which displays the 10 best-performing posts over the selected period, ranked by views, likes, new viewers, or new followers generated.
Viewing duration and watch time
Average watch time represents the average amount of time viewers spent on your video. The retention rate is the percentage of the video actually watched. According to the TikTok Creator Academy, these two metrics are among the most important for assessing a post's performance and understanding when viewers drop off.
Compare watch time with the total length of your video: a high ratio - for example, 80% watched on a 30-second video - is a good indication of a strong hook. Producing shorter content is not always preferable - a 3-minute video with 60% retention generates more total watch time than a 15-second video watched to 100%, even though the two signals have different implications for distribution.
The second-by-second retention rate
By clicking a video in the Content tab, you can access its retention curve: a chart showing the percentage of viewers still present at every second. Read it as follows:
- Sharp drop in the first 2-3 seconds: your visual or audio hook is not holding attention. Rethink the opening edit.
- Flat plateau followed by a drop: a slow point in your content is causing viewers to leave. Identify the exact second and trim that section.
- Curve rises again: viewers are going back to rewatch a segment. That moment is perceived as especially useful or impactful - use this format in your next videos.
- Ends at 90% or more: your conclusion works well and viewers stay until the end.
Engagement metrics by video
For each post, TikTok displays likes, comments, shares, and saves. Shares and saves are particularly revealing: they show that a viewer considers your content useful or entertaining enough to redistribute or keep. A high share rate can indicate broad distribution potential that view volume alone does not reveal.
Calculate an engagement indicator for each video: (likes + comments + shares) / views x 100. Compare it across your productions to identify which ones genuinely prompt interaction, regardless of their raw reach. This analysis will give you a clearer picture of your most effective editorial formats.
Traffic sources: understanding where your views come from
TikTok breaks down the origin of every view into several traffic sources. This breakdown is strategic because each source has a different meaning for your growth.
- For You (FYP): views from the “For You” page represent algorithmic distribution. A high share indicates that your content is being pushed beyond your existing audience.
- Followers: views generated by your followers in their feed. A large share indicates a loyal audience, but it may also signal that distribution to new profiles is limited.
- Search: viewers found your video through keywords. Optimizing your captions, subtitles, and titles with terms searched by your target audience can improve this source.
- Profile: views from direct visits to your page. This is often linked to external mentions by another creator, the press, or a campaign.
- Hashtags: views from hashtag pages. They are useful for semantic categorization, even though their weight in distribution has changed.
- Sounds: if you use a trending sound, viewers may discover your content through the sound's page.
If most of your views come exclusively from your followers, your content is not yet spreading beyond your current sphere. This is the time to experiment with different formats or analyze videos in your sector that generate more FYP traffic.
Note on amplification services: some creators consider using third-party services to buy views, likes, or followers. It is important to know that the TikTok Community Guidelines explicitly prohibit “trading services that artificially increase engagement or trick the recommendation system.” If detected, TikTok may remove artificial signals and restrict the account's visibility. If you want to explore options that complement your organic analysis, learn about the available TikTok view options while remaining fully aware of this regulatory framework.
Followers tab: analyzing your audience demographics
The Followers tab reveals who actually watches you, rather than who you imagine you are reaching. This data shapes all your editorial decisions: tone, schedules, formats, and topics.
Geographic and language distribution
TikTok displays the territories where your followers are concentrated. If you create content in French but a significant share of your audience is based in a non-French-speaking country, this may be explained by a universal topic such as humor or music, or by an anomaly worth investigating. Knowing your community's geography also helps you adapt the cultural references in your videos.
Distribution by gender and age group
This data allows you to check the alignment between your actual audience and your target. An account aimed at entrepreneurs aged 25-40 that mainly attracts 16-20-year-olds must reconsider its positioning or accept a pivot toward that segment. Neither option is wrong, but the decision must be conscious and documented.
Audience activity and the best times to post
In the Followers tab, TikTok displays a chart showing the days and times when your followers are most active on the platform, down to hourly granularity. According to the TikTok Creator Academy, it is advisable to post on the most active days and no more than two hours before the activity peak, to capture the growing audience and build momentum before the peak. Cross-reference this data with our guide to the best times to post on TikTok to refine your schedule for your specific audience - not generic averages.

Third-party analytics tools: going beyond the native interface
Native TikTok Analytics covers the essentials, but it has real limitations: no integrated competitive analysis and no recurring automated exports. Third-party tools fill these gaps for creators and marketing teams that need a broader view.
Pentos, Exolyt, and Storyclash
Pentos tracks how any TikTok account changes over time, including competitors, with extensive historical data. Exolyt stands out for its analysis of sound trends and hashtags with strong distribution potential. Storyclash focuses on influencer marketing: it makes it easier to identify creators based on their actual engagement metrics, not only their follower counts. These tools are third-party services independent of TikTok - check their terms of use and compliance with the platform's rules before using them.
Popsters for engagement benchmarks
Popsters automatically calculates engagement rates by post and period and enables comparisons between accounts in the same sector. This is useful for assessing your share of voice in a given niche: what proportion of your sector's total interactions do you capture compared with your competitors?
These tools are particularly useful during an audit or when launching a new editorial direction. For daily use, the native TikTok Studio interface is more than sufficient if you devote 15 to 20 disciplined minutes to it each week.
Turning your data into a concrete action plan
Reading figures is pointless without a structured improvement loop. Here is a four-step method you can apply immediately.
- Weekly audit: every Monday, record the 3 best- and worst-performing videos from the previous week in a table. Identify what differs: format, duration, topic, music, or posting time.
- Hypothesis and test: formulate a precise hypothesis (“my videos with on-screen text retain viewers better than those without it”) and test it over the next two weeks with a dedicated format.
- Retention curve analysis: for each test, read the curve second by second and note the drop-off point. Adjust the editing for your next productions.
- Amplify the winners: a video that significantly exceeds your average watch time deserves special attention. You can explore complementary levers such as TikTok likes or reposts - while keeping in mind the TikTok Community Guidelines framework mentioned above.
This rapid iteration approach applies equally to a personal account or a brand managing several profiles simultaneously. For teams, combining organic analysis with complementary levers to increase TikTok views can shorten testing cycles.
Ready to boost your presence?
Place your order in 2 minutes, drip-feed delivery, credible profiles, retention guarantee.
Frequently asked questions
How do you access TikTok Analytics on mobile?
From your TikTok profile, tap the three-line icon at the top right, select “TikTok Studio,” then “Analytics” > “View all.” Access requires a previously enabled Creator or Business account. On a computer, the same interface is available at studio.tiktok.com, with additional export options.
What is the difference between views and reach in TikTok Analytics?
Views count every play of your video, including multiple views by the same user. Reach is the number of unique accounts that watched at least once. If your views are significantly higher than your reach, part of your audience is watching the same video several times - which may indicate content with a strong hook or memorable value.
What is a good retention rate on TikTok?
There is no universal threshold officially published by TikTok, because it depends on the video's length and niche. As a guide, average retention above 70% on a short video of less than 30 seconds is often considered strong by practitioners. For longer videos of more than one minute, rates between 40% and 60% may already be significant. The key is to compare your own videos with one another to identify your most effective formats over time.
Is TikTok Analytics available for free?
Yes, access to TikTok Analytics through TikTok Studio is completely free for all Creator and Business accounts. The only requirement is to switch your account in the settings, which costs nothing and removes no features. Third-party analytics tools such as Pentos or Exolyt offer advanced features through paid subscriptions, but they are not essential when starting out.
How often should you check your TikTok Analytics?
A thorough weekly review is enough for most creators. Set aside 15 to 20 minutes each week to analyze your recent videos, note trends, and adjust your content schedule. Avoid checking analytics several times a day for recent videos: data from the first few hours can be unstable and lead to premature conclusions about a post's actual performance.
What are TikTok's rules on buying engagement?
The TikTok Community Guidelines explicitly prohibit trading services that artificially increase engagement or seek to trick the recommendation system. If detected, the platform may remove artificial metrics and restrict the visibility of the account concerned. Any decision to use third-party amplification services must take this risk into account.
Summary and next steps
Mastering TikTok Analytics means developing a competitive advantage that most creators neglect. The TikTok Studio interface already provides everything needed to make informed decisions: second-by-second retention, traffic sources, demographics, engagement metrics by video, and an exportable history of up to 365 days. Third-party tools complement it for competitive analysis or team requirements.
Start by enabling your Creator or Business account if you have not already done so, then devote your first audit to your 10 most recently published videos. Rank them by watch time, read their retention curves, and identify the format that generates the most followers. This analysis alone will teach you more than a month of publishing without critical feedback. To take your growth strategy further, explore how to combine an organic approach with complementary levers to grow your TikTok followers sustainably.
Julie Faure
Senior Writer — Social Media
✍️ Professional writer. Web content, SEO & brand content. Specialized in social media & digital marketing.
Julie supports creators, brands and entrepreneurs on their social media strategies and online visibility. She shares hands-on, field-tested advice here to help you understand algorithms, create content that genuinely engages, and turn social presence into a real business growth lever.
Related services
Buy TikTok Likes
Send TikTok’s algorithm the signal it needs to push your videos to the For You Page with a burst of authentic likes.
Buy TikTok Followers
Break through the psychological barrier of an established TikTok profile and activate the “For You” algorithm with active followers delivered gradually.
Buy TikTok Views
Boost your TikToks to the For You Page with fast views delivered securely, without risking your account.
Related reads
What Time to Post on TikTok? The Complete 2026 Guide
Hours spent filming, editing and refining your TikTok video... only for it to flop. What if it wasn't your fault? Sometimes, even perfect content fails to break through on TikTok. The real issue lies elsewhere: you didn't post at the right time on the platform. On...

How to grow on TikTok: 10 strategies that really work
Want to grow on TikTok consistently? This guide presents 10 practical strategies — from authentic content to platform SEO — to increase followers, engagement, and real visibility.

Best Times to Post on TikTok: Complete Guide
Discover the best times to post on TikTok across all days of the week. Learn how the algorithm prioritizes timing, optimize your posting schedule by industry and audience location, and use analytics to find your optimal posting windows for maximum engagement.

How to Gain TikTok Followers? Our Tips and Tricks
Gaining more TikTok followers is a priority for many creators looking to develop their online presence. Competition is fierce, with every profile aiming to stand out through viral videos that drive engagement. Here are proven strategies to attract and...