WhatsApp channel engagement: metrics to track
View rate, reactions, reach per post... Measuring WhatsApp channel engagement means knowing which indicators to examine and how to interpret them to make better editorial decisions.


Contents 8 sections
- 1 Understanding the native WhatsApp Channels dashboard
- 2 Fundamental engagement metrics to monitor
- 3 Average reach and audience retention
- 4 Advanced metrics and results-oriented KPIs
- 5 How subscriber volume affects metric reliability
- 6 Optimizing your content using data
- 7 Summary: building an effective monitoring dashboard
- 8 Frequently asked questions
WhatsApp channel engagement cannot be measured by gut feeling. Unlike a group or Instagram page, a WhatsApp channel broadcasts content one way - making data analysis even more necessary to understand what truly resonates with your audience. Without clear indicators, you are publishing into a void.
The real challenge: WhatsApp Channels provides native statistics, but interpreting them requires a solid framework. Is a 40% view rate good or bad? Does a decline in reactions indicate waning interest or a publishing-frequency problem? These questions deserve precise answers, not approximations.
This guide explains the essential metrics to monitor, how to read them, and which concrete actions to take to improve your channel’s performance week after week.
Understanding the native WhatsApp Channels dashboard
WhatsApp includes an activity report accessible directly from your channel management interface. This area, called channel insights, centralizes performance data for each post and provides an overall view of your audience growth.
Where to find your channel statistics
In the WhatsApp app, open your channel as an administrator, then tap the channel name to access its settings. The metrics and insights section gives you access to data for every individual post, along with aggregated data for the entire channel. Businesses with a WhatsApp Business Platform integration through Meta may have access to additional conversation-related data, depending on their chosen configuration. See the official WhatsApp Help Center page about channel metrics and insights for up-to-date instructions for your operating system.
Scope of the available data
According to the official WhatsApp Channels Privacy Policy, data available to administrators mainly covers the number of channel-content views, reactions received, and the administrator’s WhatsApp contacts who follow the channel. WhatsApp does not provide detailed subscriber demographics (age or precise location) - a structural limitation to account for from the outset of your analytics approach.
An important point: unlike private messages, WhatsApp channels are not end-to-end encrypted by default. WhatsApp states this explicitly in its documentation: channels are a public broadcast service accessible to any user. This public nature explains both the potentially broad reach of posts and the limited scope of analytics data WhatsApp chooses to expose to administrators.
These initial indicators provide the foundation. But to truly measure WhatsApp channel engagement, you must go beyond simply counting views and build actionable ratios.
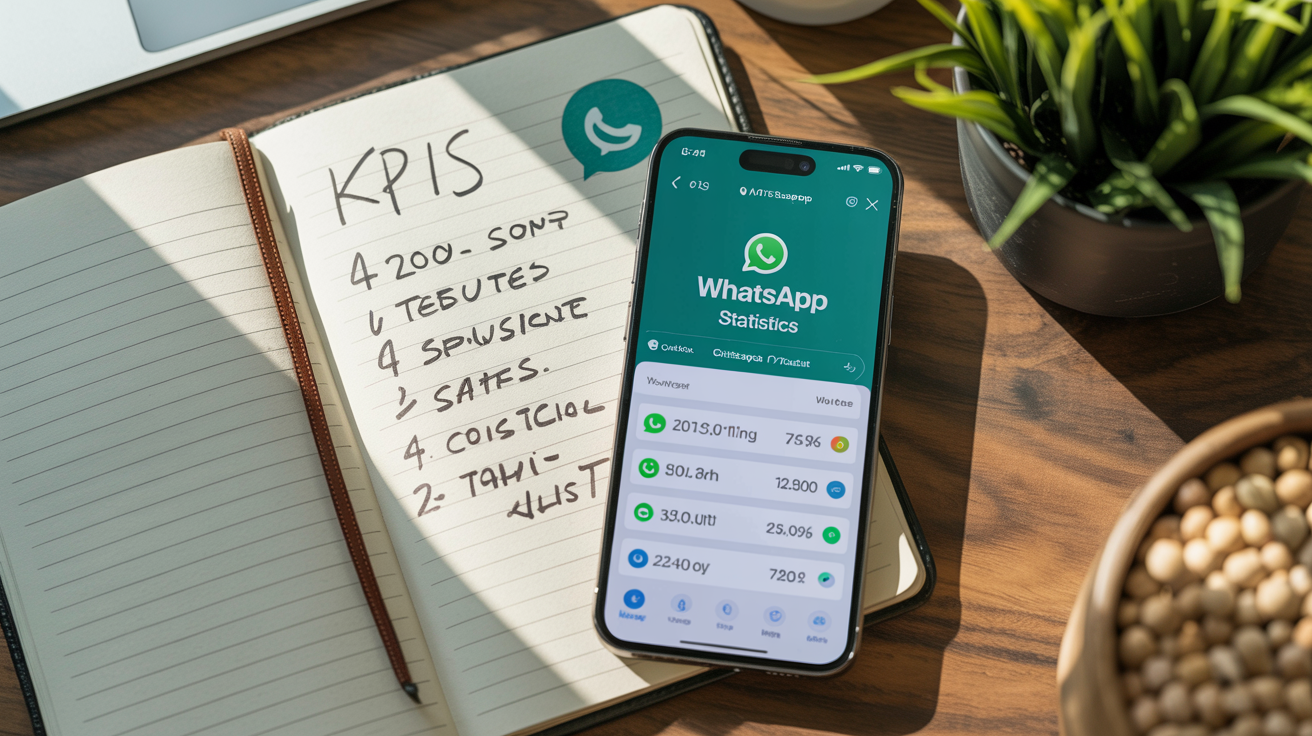
Fundamental engagement metrics to monitor
Measuring WhatsApp channel engagement relies on four primary indicators. Each tells part of the story; none is sufficient alone.
View rate (views / active subscribers)
The most direct metric is the ratio between a post’s number of views and your channel’s total number of subscribers. If your channel has 1,000 subscribers and a post records 450 views, your view rate is 45%.
One important nuance: according to the official WhatsApp Channels policy, channel content may be seen not only by subscribers but also by non-subscribers (called “Viewers”) who discover the channel through the directory or a shared link. The view count may therefore include these external audiences, potentially slightly overstating actual engagement among your subscriber base. Keep this nuance in mind when interpreting your data.
WhatsApp Channels does not work like Instagram or TikTok: there is no editorial distribution algorithm amplifying or suppressing your posts in subscribers’ feeds. A gradually declining percentage of views may indicate audience fatigue or a perceived lack of content relevance - to be analyzed alongside unsubscribes.
Reactions: the main active-interaction signal
Unlike private messages, WhatsApp has no “double blue checkmark” mechanism for channel posts. For channels, the read indicator is the view count shown below each post - the closest available data to an open rate, although it cannot distinguish a complete read from a quick glance.
Reaction rate (reactions / views)
Reactions (emojis that subscribers and visitors can add to your posts) are the strongest interaction signal available on WhatsApp Channels. The useful calculation is not the raw number of reactions but the reactions-to-views ratio. A post viewed 500 times with 80 reactions has a 16% reaction rate - far more meaningful than an absolute count.
A high reaction percentage indicates content that triggers an emotional or intellectual response. Analyze which formats, topics, or tones generate the most reactions and use those findings as the basis for future posts.
Net subscriber growth
Subscriber count alone is a vanity metric. What matters is net growth: new subscribers minus unsubscribes over a given period. A channel that gains 200 subscribers but loses 180 is effectively stagnating, even if its total count rises slightly. Track this metric weekly to detect peaks (linked to a widely shared post or external mention) and dips (often correlated with excessive frequency or declining quality).
These four fundamental indicators already provide an accurate picture of your channel’s health. To manage a sustainable content strategy, supplement them with reach and retention metrics.
Average reach and audience retention
Average reach per post is the average number of views recorded by your recent content. Calculate this average across your last 10 or 20 posts to smooth out one-off effects and obtain a reliable baseline.
Why average reach is more useful than peak views
A single widely shared piece of content can send your peak views soaring without reflecting your channel’s usual performance. Average reach reveals what your audience consumes regularly. Use this basis to calibrate expectations and assess the impact of editorial optimizations.
A useful technical reminder: WhatsApp retains channel content on its servers for a maximum of 30 days. After that, posts are no longer accessible through the Updates tab, meaning your view data may also evolve within this window. Account for this in your analytics monitoring: export or record your metrics regularly instead of relying on a long history.
Implicit retention rate
By monitoring average reach month after month, you can see whether your audience remains engaged over time or loses interest. Stable or growing reach with a stable subscriber count means your retention rate is satisfactory: existing subscribers continue opening your posts. Declining reach while the subscriber base grows is a warning sign: you are gaining passive subscribers who stop opening your content after the first few days.
The issue of retention is directly related to the initial quality of your subscriber base - a topic discussed later in this article.
Advanced metrics and results-oriented KPIs
Beyond WhatsApp’s native statistics, marketing teams using channels professionally structure their analysis around results-oriented KPIs. These advanced indicators connect editorial performance to concrete business objectives.
Click-through and conversion rates (for channels with CTAs)
If your posts include calls to action (links to a website, forms, or promotional codes), track the click-through rate for those links using UTM parameters in your destination URL. WhatsApp Channels does not natively provide link-click data, but your web analytics tool (Google Analytics, for example) records sessions from WhatsApp as a traffic source. This lets you calculate an actual conversion rate: post views → clicks → completed actions.
Optimal frequency and its impact on engagement
Publishing frequency directly affects engagement. Publishing too rarely reduces your visibility in subscriber notifications. Publishing too often may generate unsubscribes. The optimal interval varies by sector and audience, but the method remains the same: compare view and reaction rates by day and by the intervals between posts. This data reveals the rhythm your audience tolerates and appreciates.
Attributed conversations and post-publication tracking
Businesses combining a WhatsApp channel with a WhatsApp Business account or CRM integration may be able to trace conversations initiated after a specific post. This attribution measures a piece of content’s direct impact: how many requests or exchanges were triggered by a particular post. This approach requires an appropriate technical configuration in the CRM or integration platform and is not natively available in the standard WhatsApp interface.
These advanced metrics usefully complement the fundamental indicators. But their relevance depends on one prerequisite: a sufficiently active subscriber base for the data to be statistically meaningful.
How subscriber volume affects metric reliability
A WhatsApp channel with 50 subscribers may show a 30% reaction rate - this sample is too small to be representative. Statistical indicators become reliable once a minimum volume of active audience is reached. This is why a channel’s launch phase is critical: without a critical mass of subscribers, engagement metrics fluctuate erratically and cannot support sound editorial decisions.
To understand how to build a credible initial base, it is useful to examine the practices of creators and brands that launched high-traction channels from the outset.
In this context, some teams consider buying members for their WhatsApp channel to quickly reach an audience threshold that makes statistics interpretable and strengthens the channel’s perceived credibility among new organic subscribers. However, be careful: WhatsApp has its own terms of use and channel guidelines governing administrator practices. Any subscriber-acquisition method must comply with these rules, or the channel may be restricted or removed. This approach does not replace a content strategy - it should only provide a foundation for one if it falls within the platform’s rules.
The reliability of your metrics therefore depends as much on audience quality as on size. This brings us to continuous optimization.
Optimizing your content using data
Measuring WhatsApp channel engagement only has value if the data informs concrete decisions. Here is how to structure this optimization process.
Analyze your best-performing posts
Rank the 5 posts with the highest view rate and the 5 with the highest reaction rate. These two lists are not necessarily identical. Content may be widely viewed without generating reactions (purely informational), and vice versa. Identify common factors: format (text, image, video, link), publishing time, message length, and presence of a call to action.
Test and iterate on frequency and formats
Introduce one variable at a time. If you move from 3 posts per week to 5, observe whether the average view rate falls or remains stable. If you test a new format (poll or image with short text), compare its reaction rate with your usual average. Even without sophisticated tools, this successive-testing approach produces reliable insights into what works for your specific audience.
Structure a simple weekly report
Weekly monitoring need not be complex. A four-column table is enough: publication date, view rate, reaction rate, and qualitative observation (topic, format, time). After six weeks, you have enough data to identify clear trends and adjust your editorial calendar accordingly. For useful comparison points about engagement dynamics on social platforms, the practices described in our article about proven strategies for growing a social-media audience provide additional guidance.
Data-driven optimization is not a one-time exercise. Applied regularly, it is an ongoing process that structurally improves your channel’s long-term performance.
Summary: building an effective monitoring dashboard
To manage your WhatsApp channel’s engagement rigorously, focus your monitoring on a limited number of indicators, but track them systematically.
- View rate: views / subscribers - to be tracked per post and as a moving average (bearing in mind that views may include non-subscribers).
- Reaction rate: reactions / views - an indicator of the content’s emotional resonance.
- Net subscriber growth: new subscribers minus unsubscribes over a rolling 7-day period.
- Average reach: average views across the last 10 posts.
- CTA click-through rate: measured via UTM in your web analytics tool, where applicable.
- Publishing frequency: number of posts per week, correlated with changes in view rate.
These six metrics form a complete dashboard that can be read in 10 minutes per week and is actionable enough to guide editorial decisions without drowning you in data. Start by recording them manually - even a simple file is enough. Monitoring consistency matters more than tool sophistication.
If you are new to WhatsApp Channels and want to explore the platform’s latest available features, our article about the latest services available for WhatsApp and other platforms provides a useful overview for structuring your approach from launch.
Ready to boost your presence?
Place your order in 2 minutes, drip-feed delivery, credible profiles, retention guarantee.
Frequently asked questions
How do I access my WhatsApp channel statistics?
Open WhatsApp, access your channel as an administrator, then tap the channel name at the top of the screen. A dedicated metrics and insights section appears in the channel settings. It contains views per post, reactions received, and changes in subscriber count. This feature is available on iOS and Android for all active channels. For up-to-date detailed instructions, see the official WhatsApp Help Center page about channel metrics.
What is a good view rate for a WhatsApp channel?
WhatsApp and Meta have not published an official benchmark for channels because performance varies greatly according to audience size, industry, publishing frequency, and whether your views include non-subscribers (Viewers). The key is to compare your own posts with one another to identify internal trends and improve relative to your own history.
Why is my view rate falling despite a growing audience?
This common phenomenon is explained by dilution of the active audience. New subscribers often engage less than long-standing ones, especially if they discovered the channel through an external recommendation without strong intent. Analyze whether the decline coincides with a spike in subscriptions and check whether your publishing frequency increased at the same time - notification saturation is often responsible.
Are reactions on WhatsApp Channels anonymous to the administrator?
Partially. WhatsApp states in its official documentation that administrators can see the profile name and, depending on the user’s privacy settings, the profile photo of people who interact with channel content. Other subscribers or visitors, however, cannot see other users’ reactions or identities. Administrators cannot see a subscriber’s full telephone number unless that person is already in their contacts.
Can WhatsApp Channels statistics be connected to Google Analytics?
WhatsApp Channels has no native Google Analytics integration. However, if your posts contain links to your website, you can add UTM parameters to these URLs (e.g., utm_source=whatsapp&utm_medium=channel) to track generated traffic in Google Analytics. This method lets you measure clicks and conversions attributable to your posts, even without direct integration.
Julie Faure
Senior Writer — Social Media
✍️ Professional writer. Web content, SEO & brand content. Specialized in social media & digital marketing.
Julie supports creators, brands and entrepreneurs on their social media strategies and online visibility. She shares hands-on, field-tested advice here to help you understand algorithms, create content that genuinely engages, and turn social presence into a real business growth lever.
Related services
Related reads

BoostFollowers.io Launches Its New Version! Discover It
BoostFollowers.io, the leading platform since 2011, is launching in 2024 a new version of its e-commerce site. Discover enhanced services to boost your social influence, such as buying YouTube views, Instagram or Snapchat likes, and X followers. With over 10,000 satisfied customers...

Buying Followers: Method and Criteria to Check
Review the criteria to check before buying followers, the limits of this approach, and the indicators to monitor in native analytics.

7 new services arrive: YouTube & Instagram comments, watch hours, WhatsApp and Telegram members...
Looking to boost your social media presence? Discover our new social media marketing services that will help you increase your visibility, credibility, and online success. Buy YouTube comments Comments are essential...

Telegram engagement: 7 tips to boost your channel
Is your Telegram channel stagnating despite having an existing subscriber base? Discover 7 practical tips to improve Telegram engagement, retain your community, and turn passive members into active readers.