How to analyze your Twitch performance effectively
Understanding your Twitch statistics is the foundation of serious growth. Learn how to read key metrics, interpret your creator dashboard, and make concrete decisions to develop your channel.

Contents 7 sections
Analyzing your performance on Twitch isn't reserved for large channels with thousands of viewers. It's an essential practice from your first streams, whether you're broadcasting competitive games, creative content, or debate shows. Without regularly reading your data, you're flying blind: you repeat what doesn't work and you miss what actually resonates with your audience.
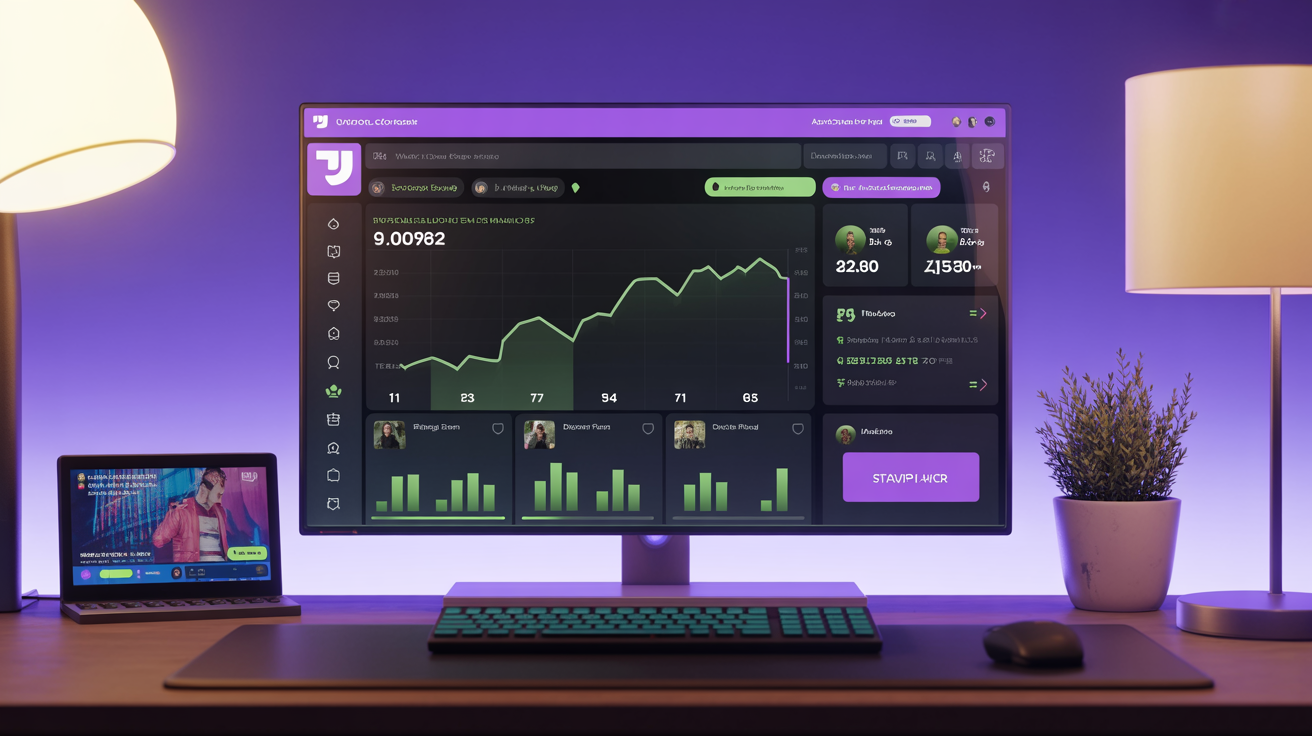
The Twitch dashboard brings together watch time, average audience, unique viewers, follows, chat messages, and discovery sources. The problem isn't a lack of data - it's knowing what to do with it. Many creators open their statistics, notice curves, then close them without drawing any actionable conclusions.
This guide explains how to read these metrics methodically, which ones to prioritize based on your growth stage, and how to transform raw numbers into concrete decisions to expand your channel.
Accessing the Twitch creator dashboard
Twitch offers a native analytics space accessible from the official Creator Dashboard. The Analytics section contains several pages. Two views form the foundation: Overview for comparing performance over a period, and Stream Summary for examining a specific session.
Navigating the analytics interface
In the Creator Dashboard menu, start with these pages:
- Overview: global view of the last 30 days by default, with a customizable range to compare two periods.
- Stream Summary: statistics and engagement timeline of a live stream, with viewer peaks, follows, subscriptions, and clips.
- Discovery and Engagement: viewer origins, interactions, and community signals useful for explaining variations.
Start with the global view to identify a trend, then open summaries of the relevant streams and their discovery sources. A curve shows what changed; the context of the live helps you formulate a hypothesis about the cause.
Complementary third-party tools
The native dashboard covers the essentials, but tools like SullyGnome or TwitchTracker enable benchmarking by game category or content type. They provide access to useful context data: your channel's relative positioning within a niche, general platform trends, peak activity times by genre. These external sources complement your internal view without replacing it.
Once you've mastered the access, you need to know which metrics to monitor as a priority - and why some are more revealing than others.
Essential metrics for analyzing your Twitch performance
Not all displayed statistics carry the same weight. Knowing how to analyze your Twitch performance means identifying indicators that truly reflect your channel's health, rather than those that flatter your ego without operational value.
Total watch hours
Watch hours represent the total viewing volume generated by your channel over a period. This is the reference indicator for measuring overall progress, regardless of how many streams you've done. A channel that doubles its watch hours month-over-month is objectively progressing, even if viewer counts stagnate.
Don't confuse watch time with broadcast time. To become an Affiliate, Twitch currently documents four criteria to meet within the same 30-day period: reach 25 followers, broadcast for 4 hours, stream on 4 separate days, and achieve an average of at least 3 viewers over 4 days. Always check your progress in Achievements, as these conditions may change.
Average audience and peak viewers
Average audience per stream is the number of simultaneous viewers across an entire session. It's a loyalty measure: it shows how many people stay, not how many clicked once. Peak viewers captures the moment of highest viewer concentration - useful for identifying what content or announcement generated a spike.
A significant gap between these two values doesn't, by itself, prove a retention problem: it could stem from a raid, a notification, or a one-time moment. Cross-reference it with the engagement timeline, discovery sources, and follow variations to understand what actually transpired.
Unique viewers
The number of unique viewers represents Twitch's estimate of the number of distinct people who watched your streams over the period. It's a reach metric. If it grows while average audience stagnates, new people are discovering your content without sufficient evidence of better retention. Then examine arrival sources and engagement moments.
Follower growth rate
The number of new followers helps measure your channel's appeal over the period. Compare follows between multiple streams and use the engagement timeline to spot moments associated with these subscriptions, without jumping to conclusions that a single element caused them. To accelerate your initial growth and build credibility from your first streams, you can explore options to buy Twitch followers and display an already credible channel before your next stream.
Paid subscribers and associated revenue
Distinct from free followers, the number of paid subscribers is a direct monetization indicator. Twitch distinguishes Tier 1, 2, and 3, but applies local pricing that varies by country, currency, and sometimes platform. Follow the actual number of subscriptions and revenue shown in Earnings rather than a universal rate.
These basic metrics provide the diagnosis. What matters next is examining them over time, not in isolation.
Analyzing performance by stream and by period
A single statistic means nothing. It's the comparison over time - stream by stream, month by month - that reveals exploitable patterns. Analyzing Twitch performance gains full value when it becomes a regular, structured practice, not a one-time exercise.
Individual stream analysis
Stream Summary displays an engagement timeline whose granularity depends on the live duration. Examine:
- Viewer drops: note the change in pace, pause, or subject broadcasted at that moment, then compare with other streams before concluding.
- Peaks: check if they coincide with a raid, notification, clip, announcement, or particularly dynamic moment.
- Moments that generate follows, subscriptions, or clips, along with sources through which viewers found the live.
Temporal comparison
Compare identical periods to correct seasonal bias. A December month will naturally differ from August, regardless of platform. Use the dashboard's custom ranges to compare equivalent windows (30 days to 30 days, same quarter year-over-year).
A predictable schedule makes it easier to connect with your community. Measure its effect over several weeks, though: category, format, raids, and season can also shift your audience.
Category benchmarking
Your numbers have meaning relative to your niche. An average of 50 viewers in the Just Chatting category doesn't have the same reach as 50 viewers in a niche game with little competition. Third-party tools mentioned earlier allow you to position your channel within its competitive environment. This context is essential for setting realistic goals.
Temporal and comparative analysis identifies growth levers. Next comes understanding how community engagement fits into this evaluation.
Measuring engagement and community dynamics
Engagement on Twitch isn't limited to viewer counts. It encompasses the quality of live interactions - in chat, via emotes, raids, shared clips - and your community's vitality between streams.
Chat activity
Twitch Analytics offers chat messages and unique chatters. Don't confuse viewers with users logged into chat: someone can watch without opening the chat interface, and an account can stay in chat without watching the video. Compare these indicators between similar streams to spot formats that generate more interaction.
Custom emote performance
Twitch lets eligible creators offer custom emotes. When emote analytics becomes available on your account, the Engagement page shows their usage in your channel and elsewhere on Twitch. Consider these data as a signal of community adoption, not isolated proof of loyalty.
Clips and external sharing
The number of clips created from your streams and their distribution on platforms like TikTok, YouTube Shorts, or Instagram Reels is a growth vector often underestimated. A viral clip on TikTok can generate a significant influx of new viewers to your next session. Track the number of clips created per stream and identify which moments inspire your viewers to capture and share.
If you're considering a paid lever, evaluate it separately from your organic results: check our options to buy viewers for your Twitch streams, then monitor discovery sources and actual engagement without automatically attributing variations to displayed volume. The article on buying Twitch live viewers details the criteria to verify before choosing a service.
Setting goals based on your data
Performance analysis only has value if it leads to decisions. Transforming data into concrete goals is the step most creators skip - and that's where the gap widens between those who progress and those who stagnate.
Setting target indicators
Identify two or three priority metrics based on your growth stage:
- New channel: prioritize watch time, follows received, and discovery sources.
- Growing audience: prioritize average audience, unique viewers, chatters, and engagement moments.
- Monetized channel: add subscriptions and revenue while continuing to track acquisition and retention.
Setting a goal on a single metric at a time is more effective than monitoring everything simultaneously. For example: "reach an average of 30 viewers over the next 30 days" is a clear, measurable, time-bound objective.
Pacing your analysis
A light weekly review (10 minutes after each stream) and a thorough monthly review (30 minutes with period comparison) constitute an effective rhythm. Document your observations in a simple file: what worked, what declined, what you're testing next week. This discipline creates a continuous improvement loop that platforms like YouTube, TikTok, and Instagram also encourage for their creators.
To dive deeper into multi-platform growth dynamics, the article on growing YouTube views through organic and paid methods offers useful parallels with Twitch expansion logic.
Ready to boost your presence?
Place your order in 2 minutes, drip-feed delivery, credible profiles, retention guarantee.
Frequently asked questions
What are the most important metrics for analyzing Twitch performance?
The most revealing metrics are total watch hours, average audience per stream, and follower growth rate. These three indicators cover overall volume, audience retention, and your channel's long-term appeal. Paid subscribers (subscriptions) become a priority once you've reached Affiliate status.
How do I access my Twitch channel statistics?
Go to the official Creator Dashboard (dashboard.twitch.tv), then open Analytics. Use Overview for the global view and Stream Summary for a session's details. The Discovery and Engagement pages complete the analysis with viewer origins and their interactions.
How often should I check my Twitch statistics?
A quick review after each stream is enough to note immediate trends. A more complete analysis with period comparison is recommended once a month. The goal is to identify patterns over time, not react to each one-time variation that may be statistical noise.
Are third-party tools necessary alongside the Twitch dashboard?
The native Creator Dashboard covers essential needs for most creators. Third-party tools like SullyGnome or TwitchTracker add value mainly for niche benchmarking and competitive analysis. They don't replace official data; they contextualize it.
My average audience is stagnating despite increasing watch hours: is that normal?
Yes, this happens frequently when you increase stream duration or frequency without your audience growing proportionally. It may indicate your format is gaining volume but not yet traction. Analyze your best-performing streams by average audience and identify what sets them apart: broadcast time, game or topic, session length.
Grow on Twitch through regular analysis
Analyzing your Twitch performance is a habit to develop, not a one-time task. The creator dashboard provides all the data you need to understand what works and what needs to change - provided you read it methodically and consistently.
Remember three concrete steps to get started: access your Creator Dashboard this week, choose two priority metrics suited to your growth stage, and commit to systematic post-stream reviews. Growth on Twitch is rarely dramatic in the short term - it builds through successive iterations, each guided by what your data reveals. For those seeking to accelerate this trajectory, building your Twitch follower base can be a useful complementary lever to establish credibility in your channel during this expansion phase.
Julie Faure
Senior Writer — Social Media
✍️ Professional writer. Web content, SEO & brand content. Specialized in social media & digital marketing.
Julie supports creators, brands and entrepreneurs on their social media strategies and online visibility. She shares hands-on, field-tested advice here to help you understand algorithms, create content that genuinely engages, and turn social presence into a real business growth lever.
Related services
Buy Twitch Followers
Establish instant credibility on Twitch and attract hesitant viewers to subscribe. Boost your channel’s social proof before your next stream.
Buy Twitch Live Viewers
Give your Twitch streams instant visual energy that attracts viewers from the first minute and retain real, active audiences longer.
Related reads
Buy Twitch Followers: Real & Fast Delivery in August 2026
Want to buy Twitch followers and grow your channel faster in August 2026? This guide covers real vs. bot followers, delivery speed, package options, and how to stay safe - everything you need before placing an order.
Buy Twitch live viewers in August 2026
Buying Twitch live viewers accelerates channel growth by boosting algorithmic visibility. This complete guide analyzes service offerings, account safety, and best practices in August 2026 to achieve lasting results and sustainable growth.
How to grow your SoundCloud audience: complete guide
Learn how to grow your SoundCloud audience with proven strategies: optimize your profile, publish consistently, use tags and metadata, build community engagement, collaborate with artists, and leverage SoundCloud's official promotion tools for independent musicians.

How to Increase Spotify Engagement: 7 Strategies That Work
Learn 7 proven strategies to boost Spotify engagement: optimize your profile, master playlists, use Canvas, drive traffic from other platforms, build social proof, track metrics, and turn events into fan moments.